
Go’s Most Underrated Performance Feature: Escape Analysis in Production
Why your variables “escape” to the heap, how that triggers GC pressure, and what every senior Go engineer should understand before optimizing performance


Most Go developers think performance problems come from:
slow SQL queries
inefficient algorithms
too many goroutines
But in real production systems, the biggest performance cost is often much quieter:
your variables are escaping to the heap without you realizing it.
Every time that happens, Go does something expensive:
allocates memory
increases garbage collector workload
adds latency under load
The scary part?
You can write perfectly “clean” Go code…
and still trigger thousands of heap allocations per second.
That’s why we need to understand one concept that changes how we write services:
Escape Analysis
In this post, we’ll go from beginner intuition to expert-level understanding — and connect escape analysis directly to what matters most:
production throughput, GC pressure
Let’s begin.
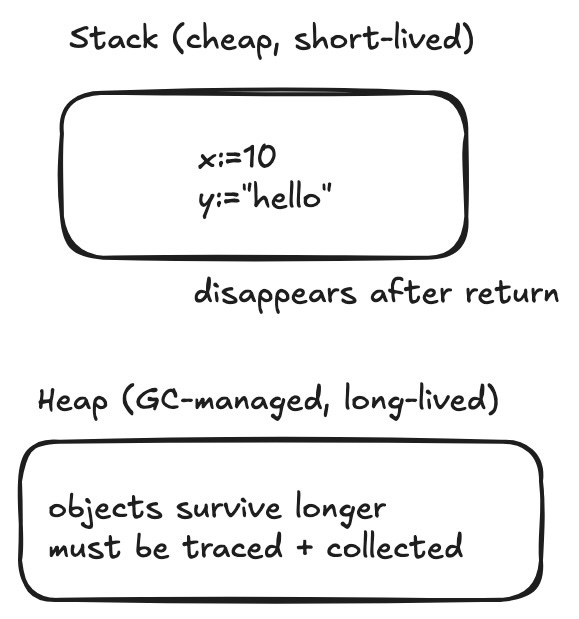
1. Stack vs Heap (The Only Starting Point You Need)
When Go creates a variable, it must live somewhere in memory.
There are two places:
Stack (fast)
local to a function
allocation is basically free
cleaned up automatically when the function returns
Heap (expensive)
used for values that outlive a function
managed by the garbage collector
increases memory churn
So the key question becomes:
How does Go decide where a variable goes?
2. Escape Analysis: The Compiler’s Decision Engine
Go decides stack vs heap at compile time using:
Escape Analysis
Escape analysis answers:
“Will this value be used after the function returns?”
If no → stays on the stack
If yes → moves to the heap
That’s it.
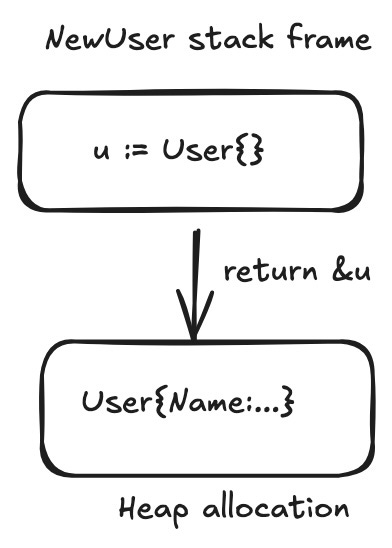
3. The Classic Escape Example: Returning a Pointer
func NewUser() *User {
    u := User{Name: "Alice"}
    return &u
}
At first glance, u looks local.
But you return its address.
So Go knows:
caller will still use
ustack frame will disappear
value must survive
So:
uescapes → heap allocation
4. Seeing Escape Analysis in Real Life
Go can tell you exactly what escapes.
Run:
go build -gcflags=”-m”
Example output:
u escapes to heap
This is one of the most valuable tools for performance debugging.
5. Escapes You Don’t Expect (But Happen Constantly)
The pointer-return example is obvious.
The dangerous ones are subtle.
5.1 Interfaces Cause Hidden Escapes
func Print(v interface{}) {
    fmt.Println(v)
}

func main() {
    x := 42
    Print(x)
}
Here, x is boxed into an interface:
type metadata stored
value stored indirectly
may escape to heap
In hot paths, interface boxing is a major allocation source.
5.2 Closures Capture Variables
func Counter() func() int {
    x := 0
    return func() int {
        x++
        return x
    }
}
x must survive after the function returns.
So:
xescapes → heap
5.3 Goroutines Force Escapes
func Start() {
    msg := "hello"

    go func() {
        fmt.Println(msg)
    }()
}
Because goroutines run asynchronously:
function returns immediately
goroutine still needs
msg
So:
msg escapes → heap
6. Why Heap Escapes Matter in Production
This is where expert-level understanding needed.
Stack allocations are cheap.
Heap allocations are not.
Heap allocations mean:
more garbage
more GC cycles
more CPU overhead
worse tail latency
Production Reality
Imagine a service doing:
50k requests/sec
2 KB heap allocation per request
That’s:
100 MB/sec allocations
The garbage collector will run constantly.
Symptoms You See in Production
memory growth
CPU spent inside GC
latency spikes at p95/p99
unpredictable performance under load
7. pprof: How This Shows Up in Real Systems
When heap escapes become a problem, profiling reveals it.
Run:
go tool pprof http://localhost:6060/debug/pprof/heap
Sample output:
runtime.mallocgc
encoding/json.Unmarshal
fmt.Sprintf
interface conversions
If you see:
runtime.mallocgcdominatingGC workers consuming CPU
You don’t have an algorithm problem.
You have an allocation problem.
8. Escape Analysis Traps in Services
This is where it gets real.
Trap 1: Missing Deadlines → Heap + Goroutine Leaks
client.Call(ctx, req)Without timeouts:
requests hang
goroutines pile up
heap grows
Always do:
ctx, cancel := context.WithTimeout(ctx, 2*time.Second)
defer cancel()
Trap 2: Logging in Hot Paths
log.Infof("req=%v", req)This causes:
interface boxing
reflection
allocations
Better:
log.Infof("userID=%s", req.UserId)Trap 3: JSON into map[string]interface{}
var data map[string]interface{}
json.Unmarshal(body, &data)
This allocates heavily.
Use concrete structs instead.
Trap 4: Returning Pointers Everywhere
func GetValue() *intGo prefers values unless mutation is required.
Pointers often escape unnecessarily.
9. Expert-Level Optimization Philosophy
Escape analysis is powerful.
But don’t turn it into premature micro-optimization.
Rule:
Optimize only hot paths.
Measure first.
Fix allocation hotspots, not random structs.
More importantly focus on:
p99 latency
GC churn
throughput under load
Not shaving nanoseconds.
Bottomline
Escape analysis is not a niche compiler detail.
It explains:
why allocations happen
why GC spikes occur
why latency worsens under load
why some Go services scale beautifully and others don’t
Once you understand escape analysis:
You stop guessing about performance.
You start engineering for production.
If you enjoyed this deep dive…
I write weekly about:
Go performance and runtime behavior
Kubernetes-native service design
Expert-level engineering lessons from real systems
Subscribe if you want more posts like this.