
PProf debug session to uncover performance problems in production
Profiling Go Applications with pprof

Performance issues in Go rarely come from “slow Go.”
They come from unseen allocation patterns, lock contention, goroutine explosions, and architectural coupling.

I am going to walk you through a typical pprof debug session in production with a real life go example and identify RCA for the performance problems and fix them for good.
we will:
Capture CPU & memory profiles
Identify hot paths and contention
Refactor the code
Re-run pprof to verify improvements
sounds good? lets go.
Our Mission: The “FastEnough” Data Processor
Let’s build a data processing service that:
Reads JSON records
Processes them through multiple transformation stages
Writes results to a simulated database
Serves metrics via HTTP
But here’s the catch: Our initial implementation has hidden performance issues that only show up under load - not during regular load.
Lets see the Problematic Implementation
First, lets define data struct to represent data model, We will define Record and Processor structs as below.
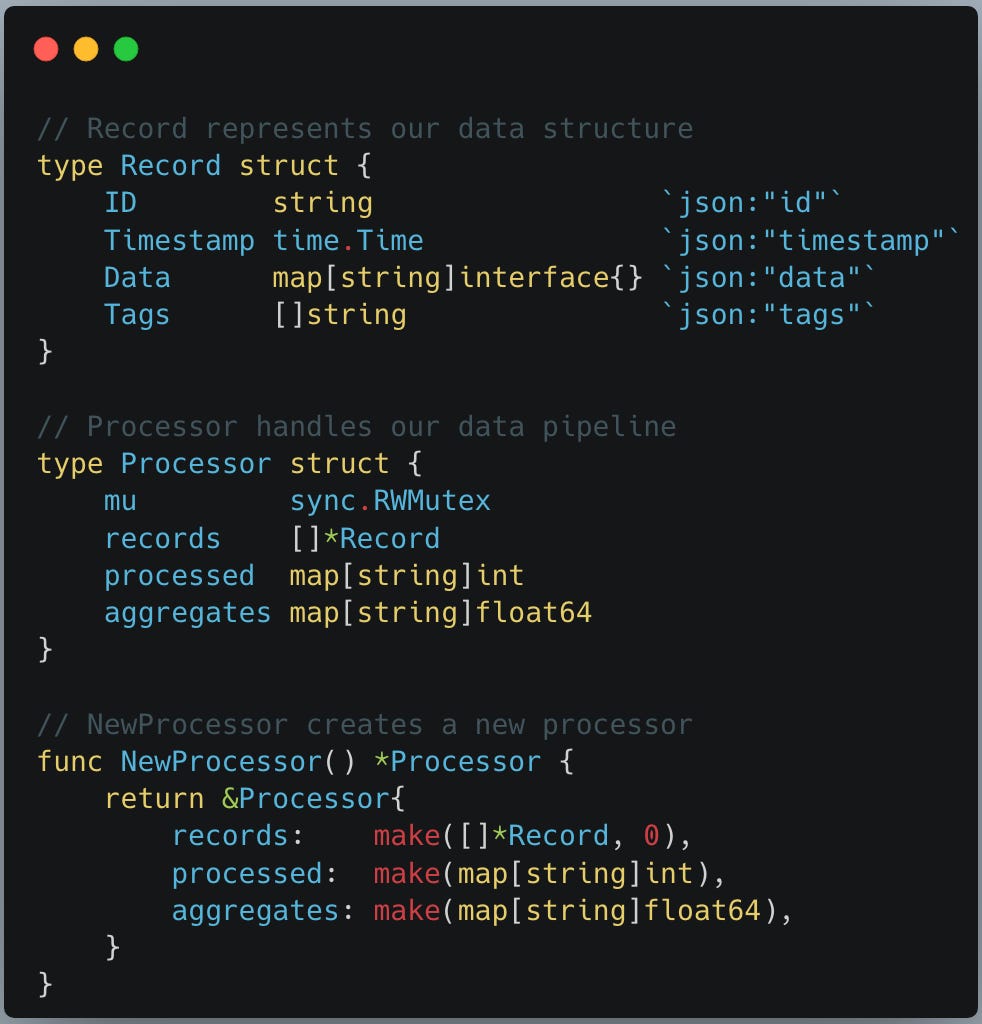
In the code snippet above a Record represent a data record that we are processing with simple fields. Processor is where our pipeline logic will live to process this record using goroutines and a NewProcessor func to create and return an object pointer for the same.
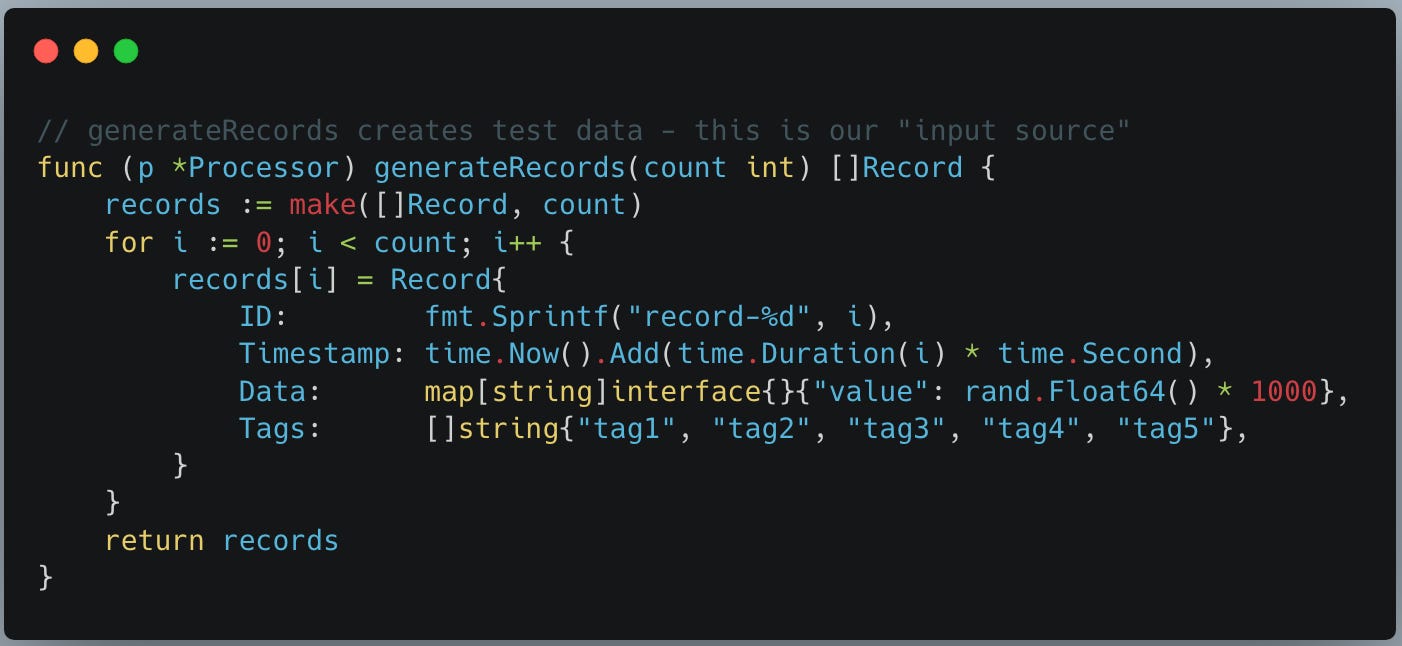
We create first func generateRecords and attach it to Processor struct. func generateRecords below helps us to generate test data as the input source for the processing.
Rest of the funcs we create below are more important as they each demonstrate an individual performance problem which we will solve using pprof.
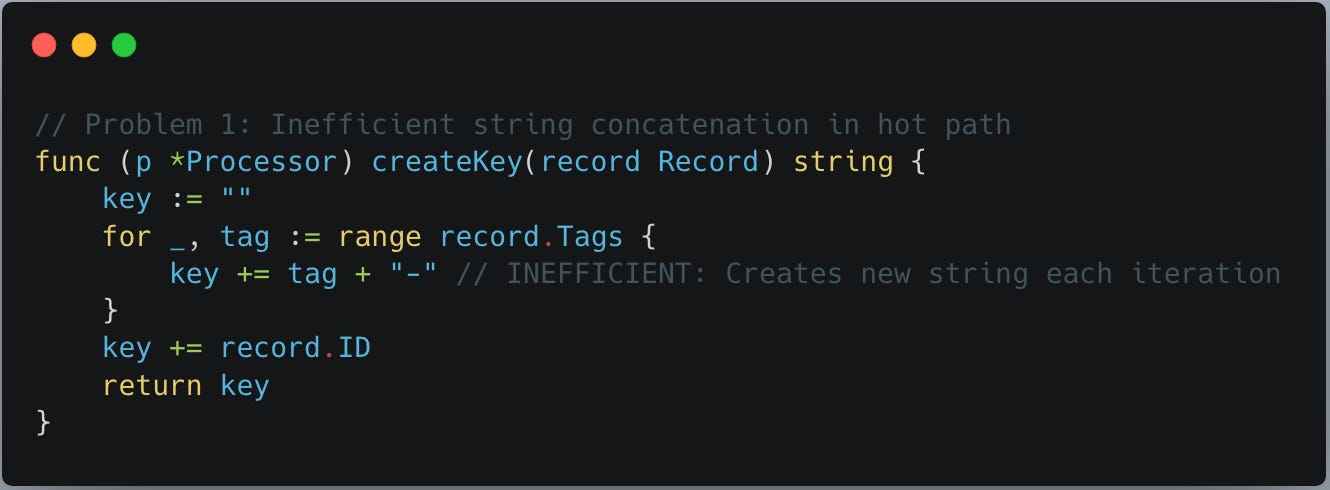
Problem 1: Inefficient string concatenation:
Note func createKey below does inefficient string concatenation inside a loop, everytime new string is created which puts stress on both memory and cpu.
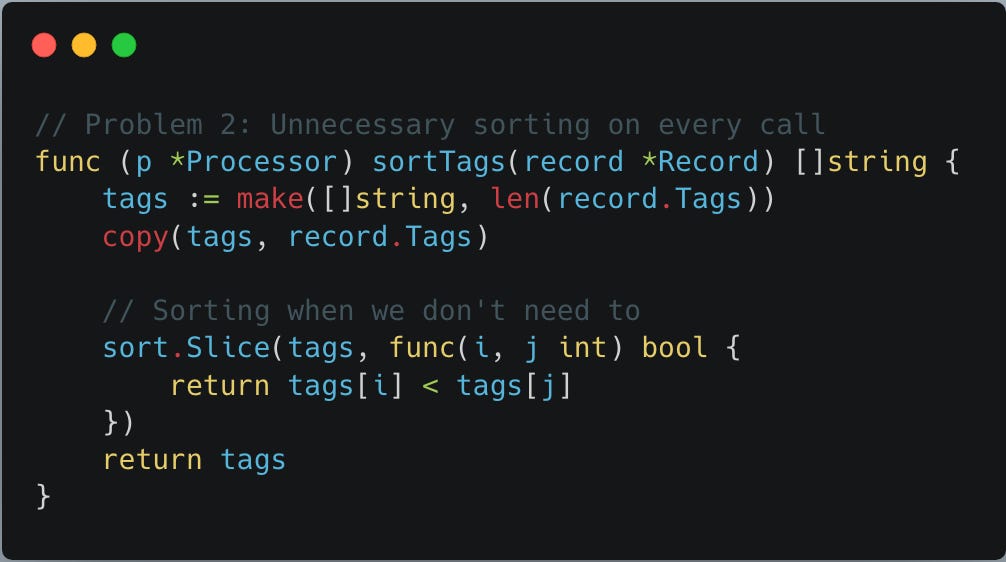
Problem 2: Unnecessary sorting on every call:
func sortTags below sorts tags on every call irrespective of whether sorting is needed or not - we will understand this better at the time of calling this func.
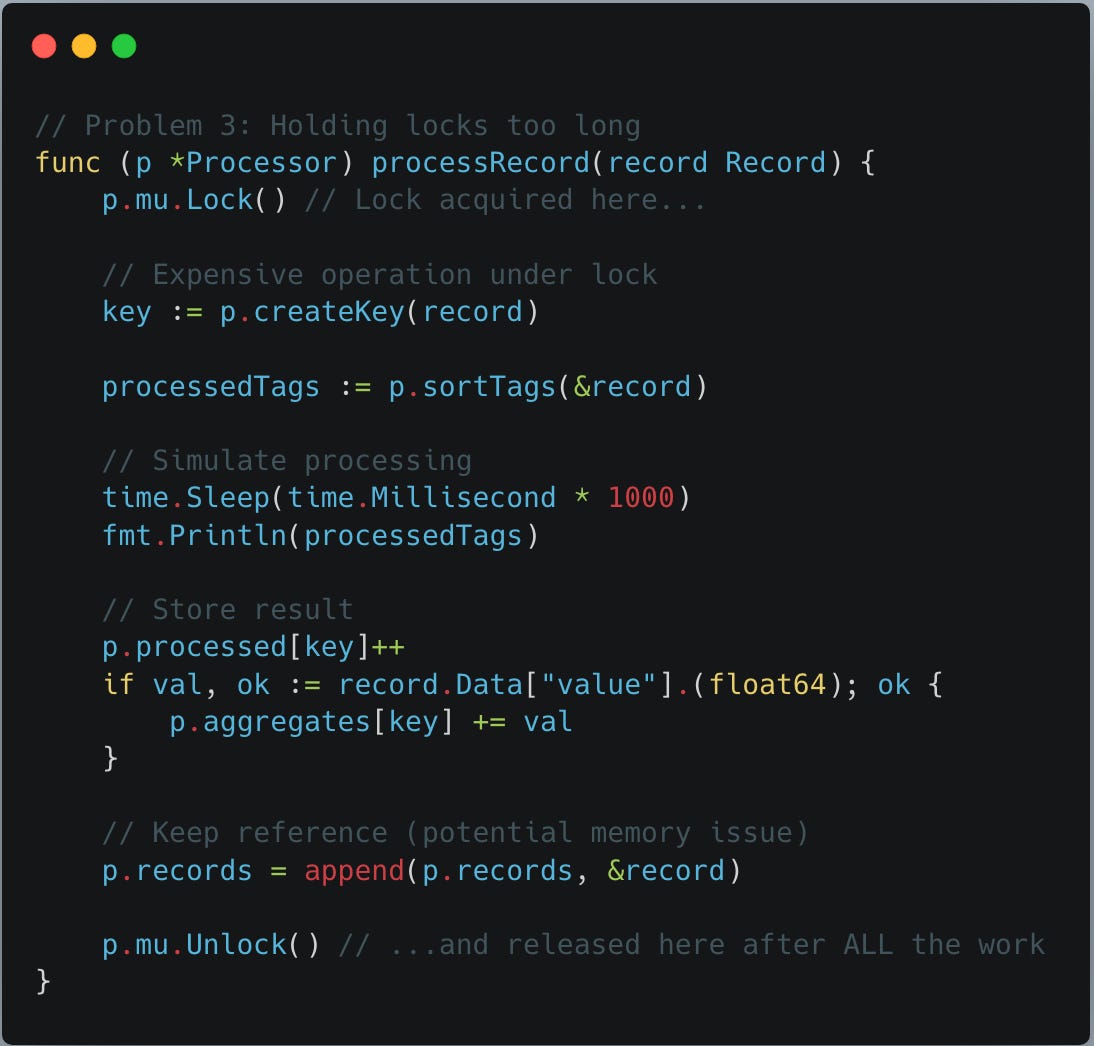
Problem 3: Holding locks too long:
following processRecord func is doing the real work, processing record. However, to avoid race condition, it uses mutex to hold lock so that only one thread can process the whole process at a time. Problem with the locking implemented below is we locked whole func logic including the logic thats more time consuming and heavy duty. So, locking is held for longer during creating contention.
Problem 4: Memory leak via goroutine:
This issue needs bit careful analysis. Here there is no memory leak due to any pointer lose but instead due to “goroutine retention” - which will be revealed by pprof not your go compiler.
First issue is goroutine oversubscription along with it stack retention for each goroutine.
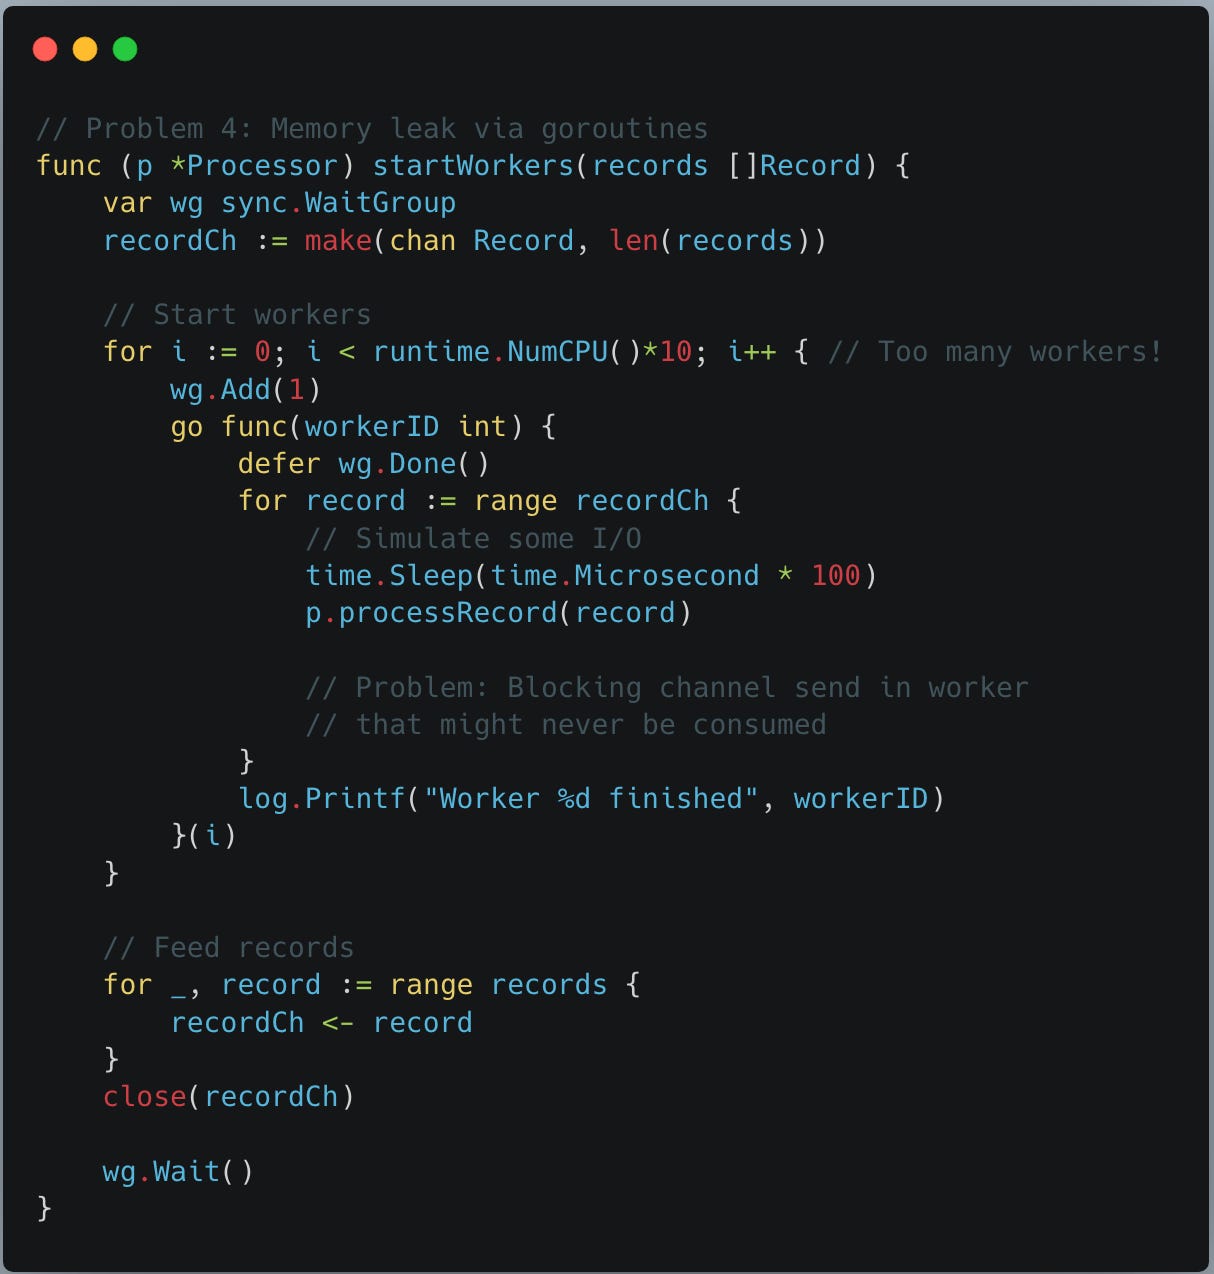
We create runtime.NumCPU()*10 goroutines.
On an 8-core machine:
80 goroutines
each with a stack (starts small, grows dynamically)
scheduler metadata
references to captured variables
Why this matters
Go cannot reclaim a goroutine’s stack until:
the goroutine exits, the function returns and the references are released.
If workers block, workers wait on channels and workers stall on locks
“their stacks stay allocated”
This looks like a memory leak in heap profiles. we will analyse and solve this as part of pprof results.
The below metricsHandler is the first REST service endpoint handler to display records processed statistics at the point of calling this endpoint.

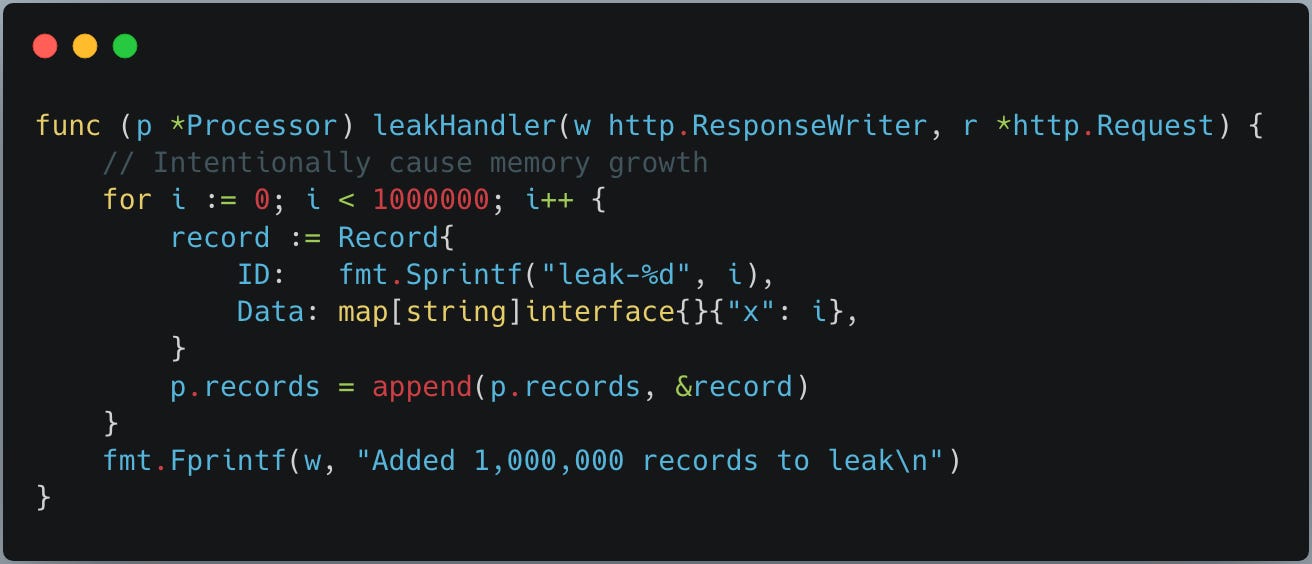
The below leakHandler is another service REST endpoint we use to cause a memory growth and leak so that we can monitor and resolve with pprof.
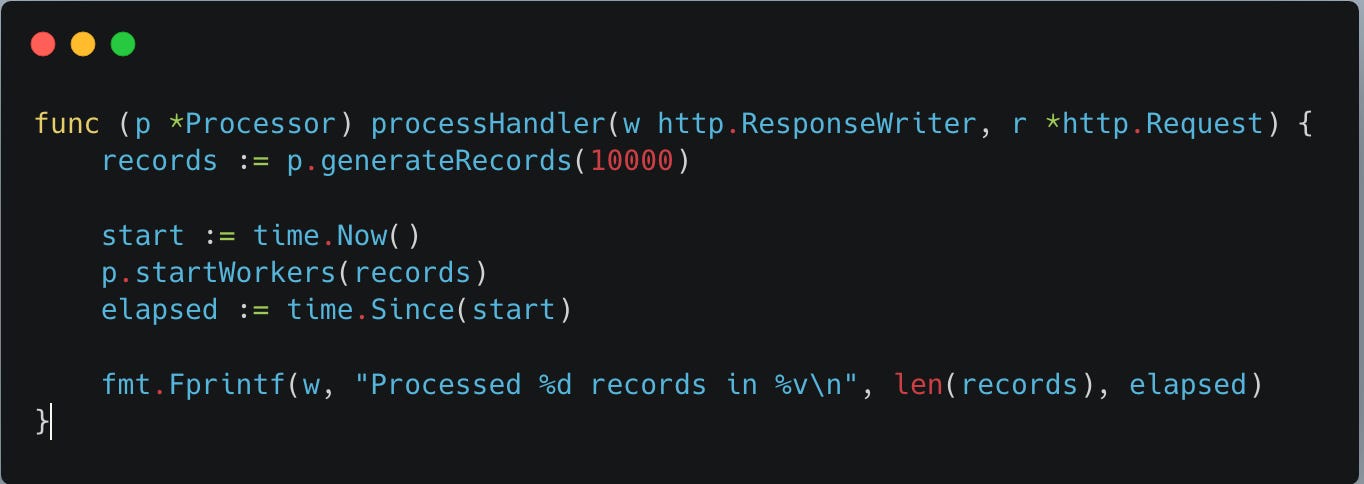
processHandler below is a main REST service endpoint handler to trigger the whole processing by generating records test data and starts gorutines to process the records so that we can observe the processing.
Last but not the least - main func. Creates new processor and hooks all the REST api handlers to a rest endpoint path on the server started on port 8080.
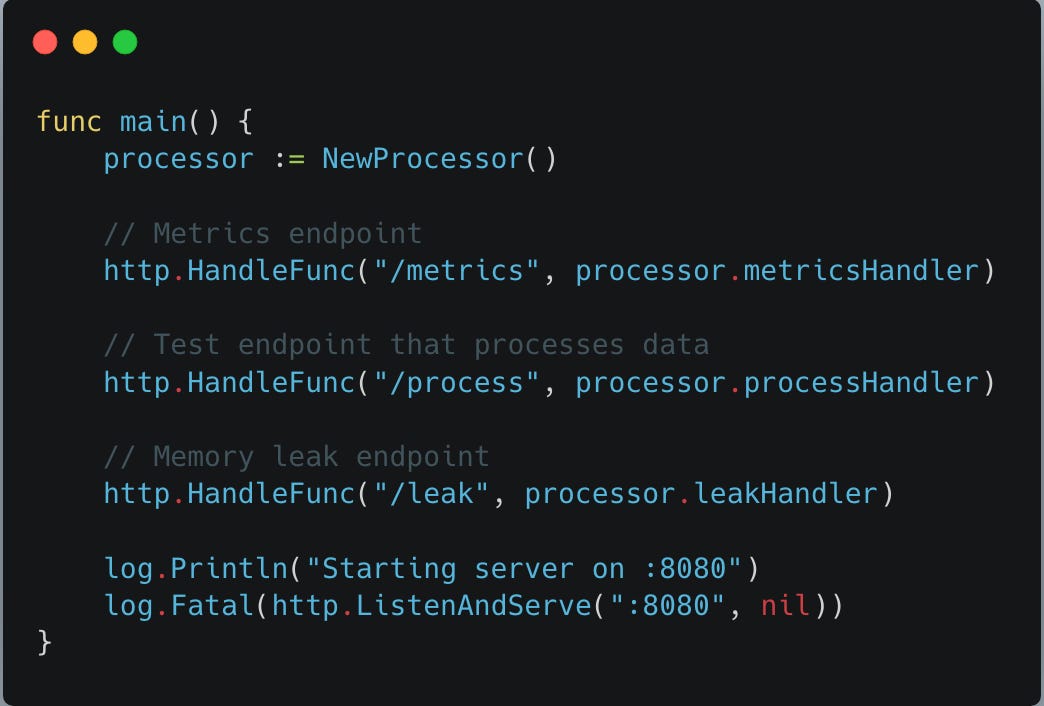
PProf setup:
Now, where is the pprof setup in main func and how pprof will work automatically, you ask! thats where a simple go magic helps setup this whole pprof profiling.
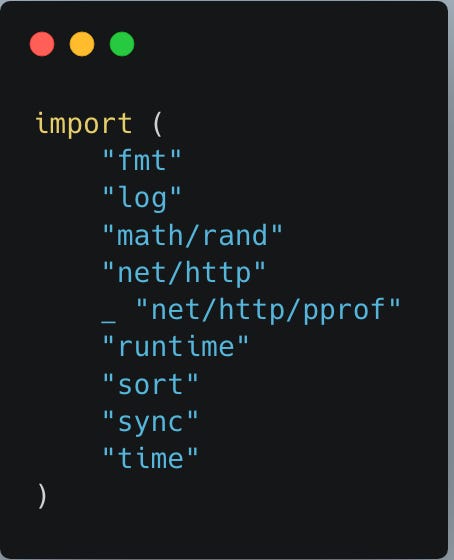
we have following imports at the top of the golang code. here
_ “net/http/pprof” import is our point of interest. This _ import tells go that we are not going to make use of any funcs from the import but instead just import them and while importing the package the “init” func from the pprof package automatically executes - just like any other go package. The init func from the package has the logic to automatically setup all the necessary endpoints for profiling at the root http server.
Pls note: In production system, your pprof server and business logic server must run in its own servers for security reasons. But, in this example analysis, we are setting up in the same server for simplicity.
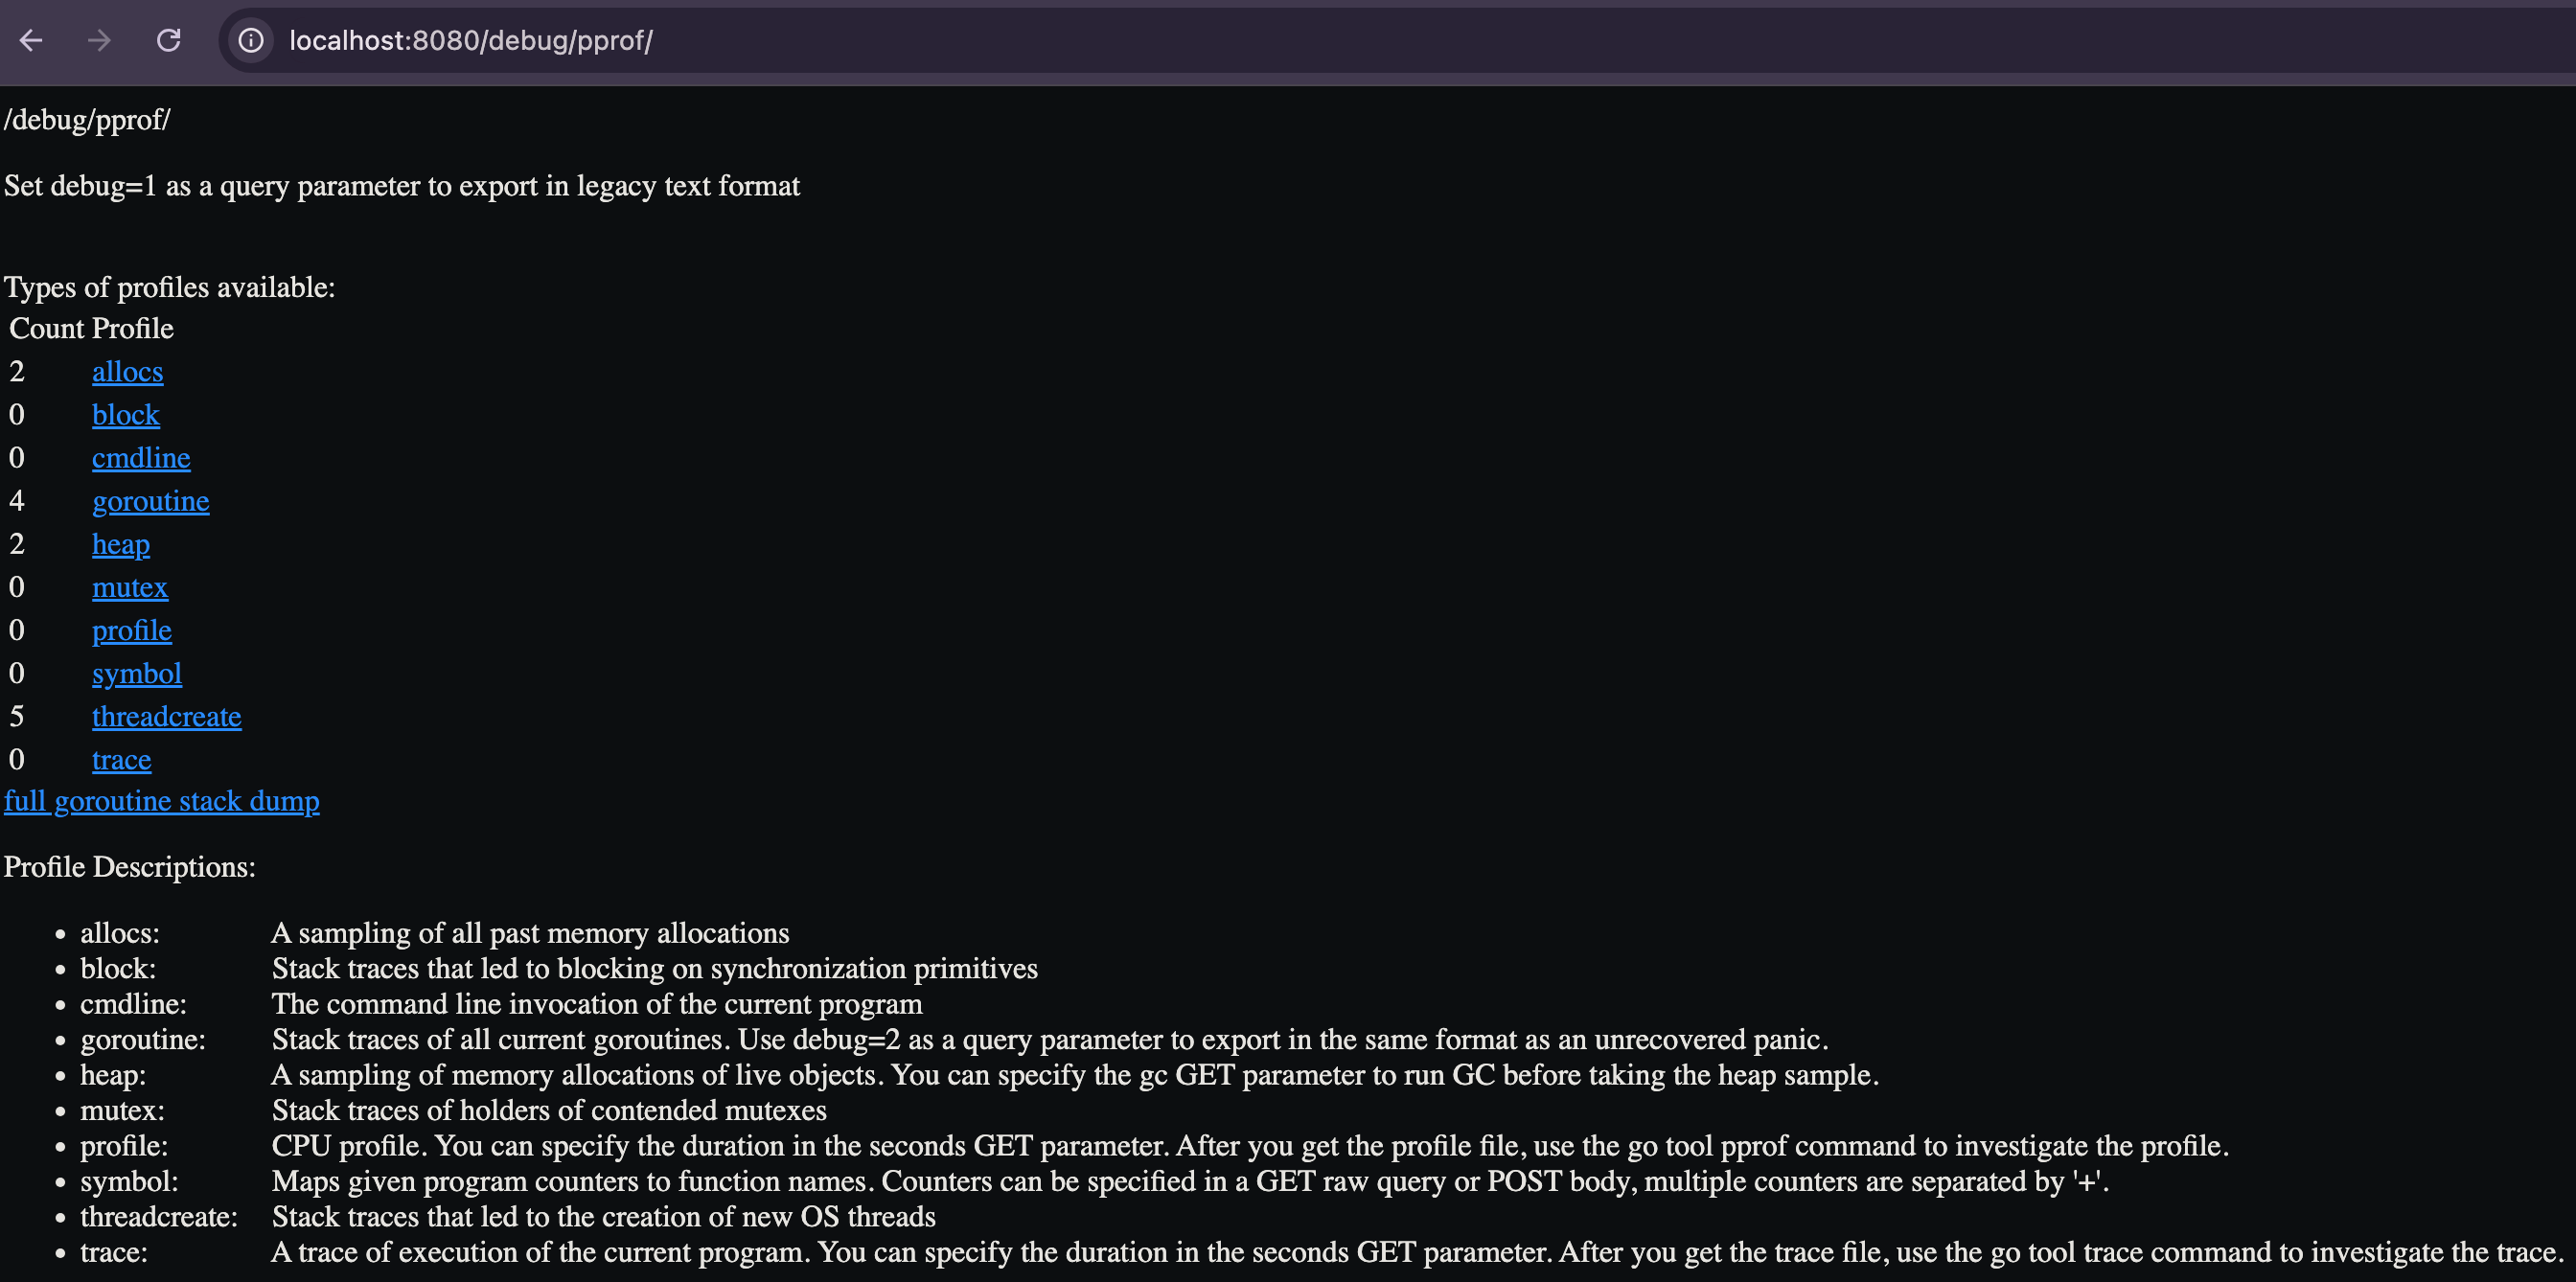
So, once pprof endpoints are setup in the server, then run the application and check the pprof endpoints are live:
➜  pprof go run pprof_demo.go
2026/02/07 12:54:19 Starting server on :8080
then visit at: http://localhost:8080/debug/pprof/
you will see following page with all the supported pprof endpoints:
In the following blog continuation, we will do pprof profiling, identify and solve all the issues we discussed.
Part2: Pprof profiling solution
If you enjoyed this deep dive…
I write weekly about:
Go performance and runtime behavior
Kubernetes-native service design
Expert-level engineering lessons from real systems
Subscribe if you want more posts like this.