
PProf debug session to uncover performance problems in production - Profiling solution
Profiling Go Applications with pprof

Part 1, Description of the go application and its performance issues

Lets start Profiling:
Run the application in one terminal:
➜  pprof go run pprof_demo.go
2026/02/07 12:54:19 Starting server on :8080
In another terminal, run below bash script, wait for to it complete and load pprof prompt.
# bash script to generate load
for i in {1..100}; do
  curl "http://localhost:8080/process"
  echo "Request $i done"
done

# Now let's capture a CPU profile
go tool pprof http://localhost:8080/debug/pprof/profile
You will see something like below for running all 100 requests and loading pprof prompt.
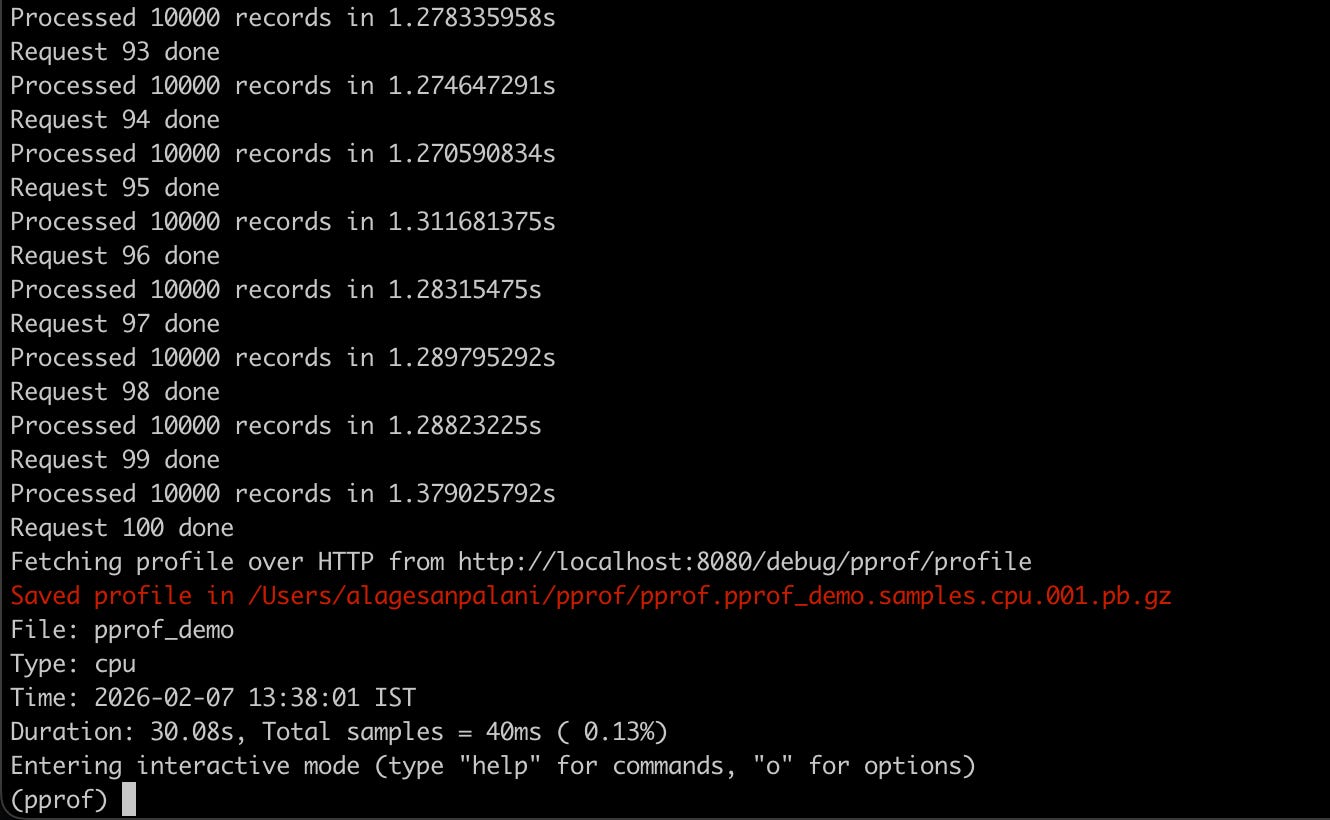
Understanding the CPU Profile
Once you have the profile loaded, try these commands:
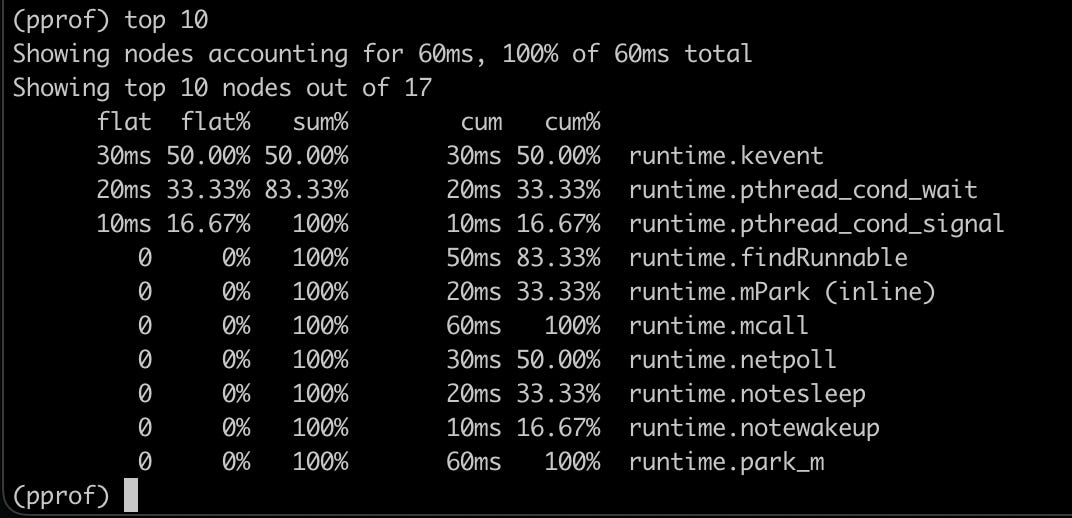
This means, It is spending almost all sampled time waiting, parking, and waking goroutines.
Goroutines are runnable only briefly
They block almost immediately
The scheduler is doing most of the work
This is coordination overhead dominating execution.
Blocker #1: Massive Lock Contention
runtime.NumCPU() * 10

------

p.mu.Lock()
p.processed[key]++
p.aggregates[key] += val
p.records = append(p.records, &record)
p.mu.Unlock()
You now have:
many goroutines
fighting for one mutex
waking → blocking → parking → waking again
Blocker #2: Buffered Channel == Burst Scheduling
recordCh := make(chan Record, len(records))This causes:
instant enqueue of all work
workers wake simultaneously
mutex contention storm
scheduler churn
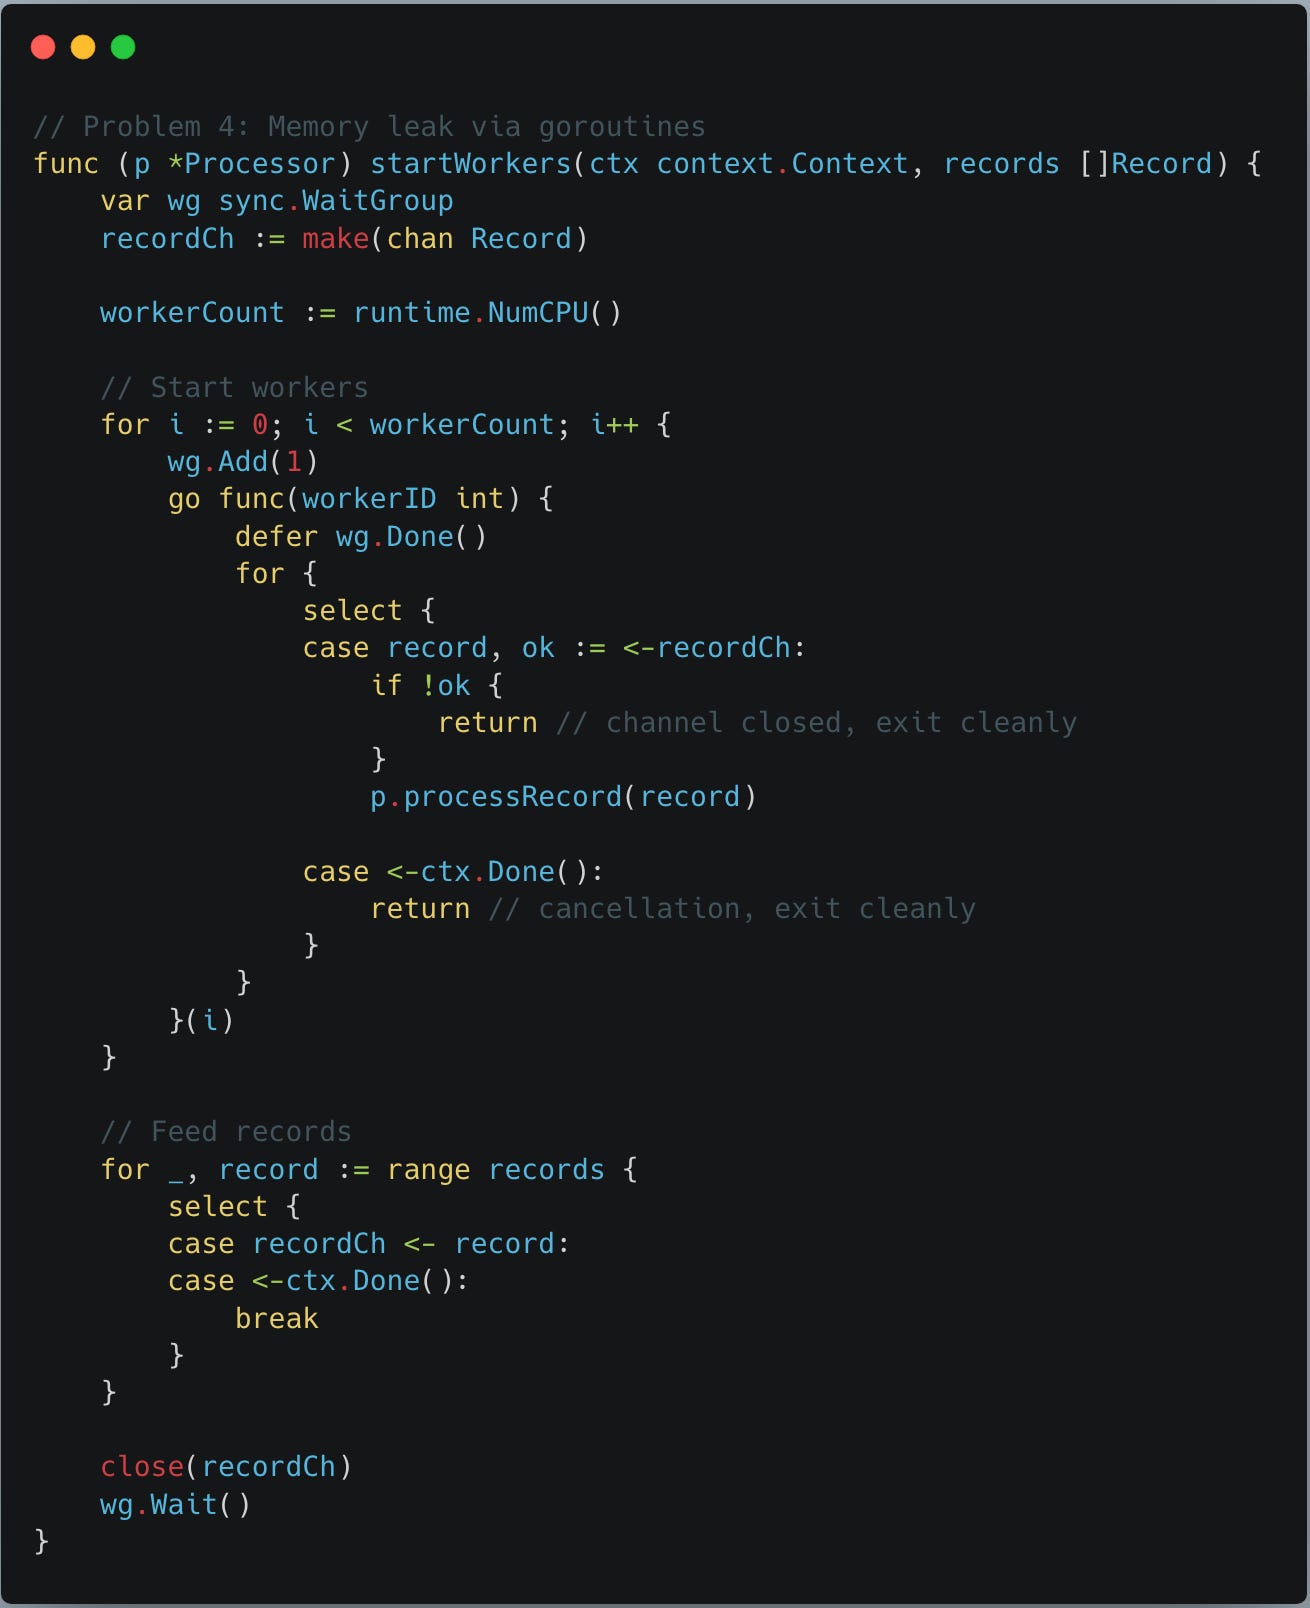
Critical fixes:
reduce goroutine count equal to core count
introduce context cancellation/done
use select case to deterministically end the for loop
Rerun the profile and see results improved on goroutine contention and locking.
Now lets identify memory issues:
go tool pprof http://localhost:6060/debug/pprof/allocswill result into:
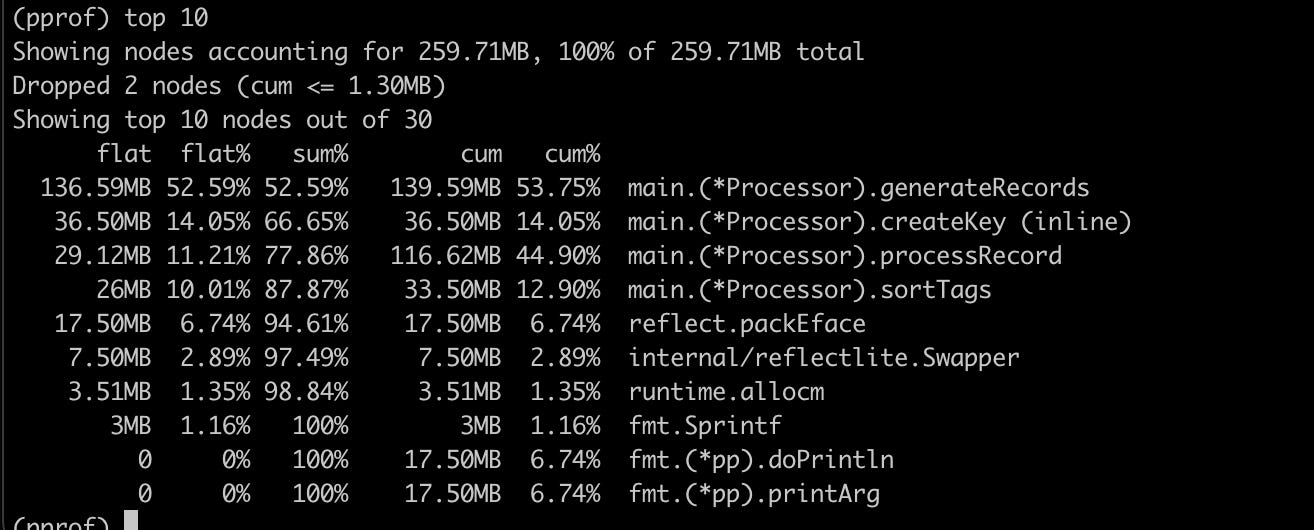
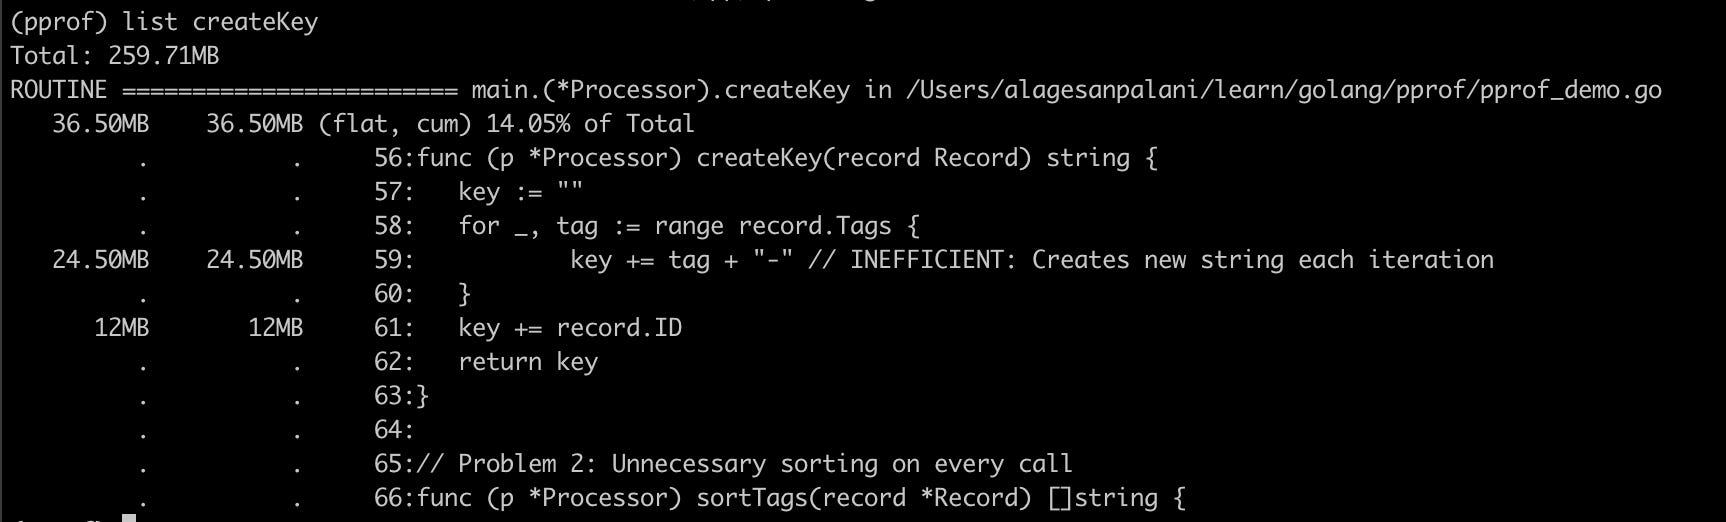
major allocations happening in generateRecords, createKey, processRecord and sortTags.
when you run “list createKey” you will see createKey has impact on string concatenation.
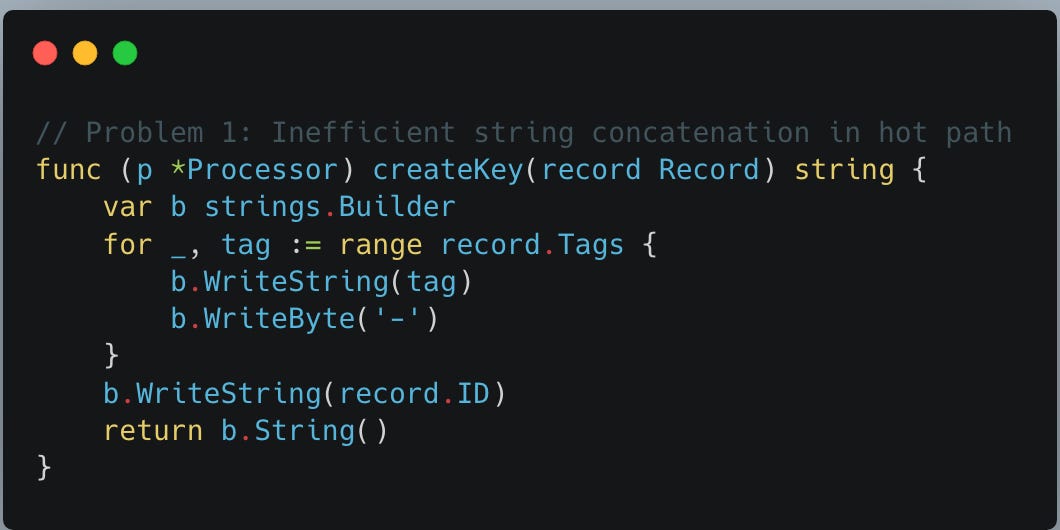
So, Lets improve createKey by introducing stringBuilder
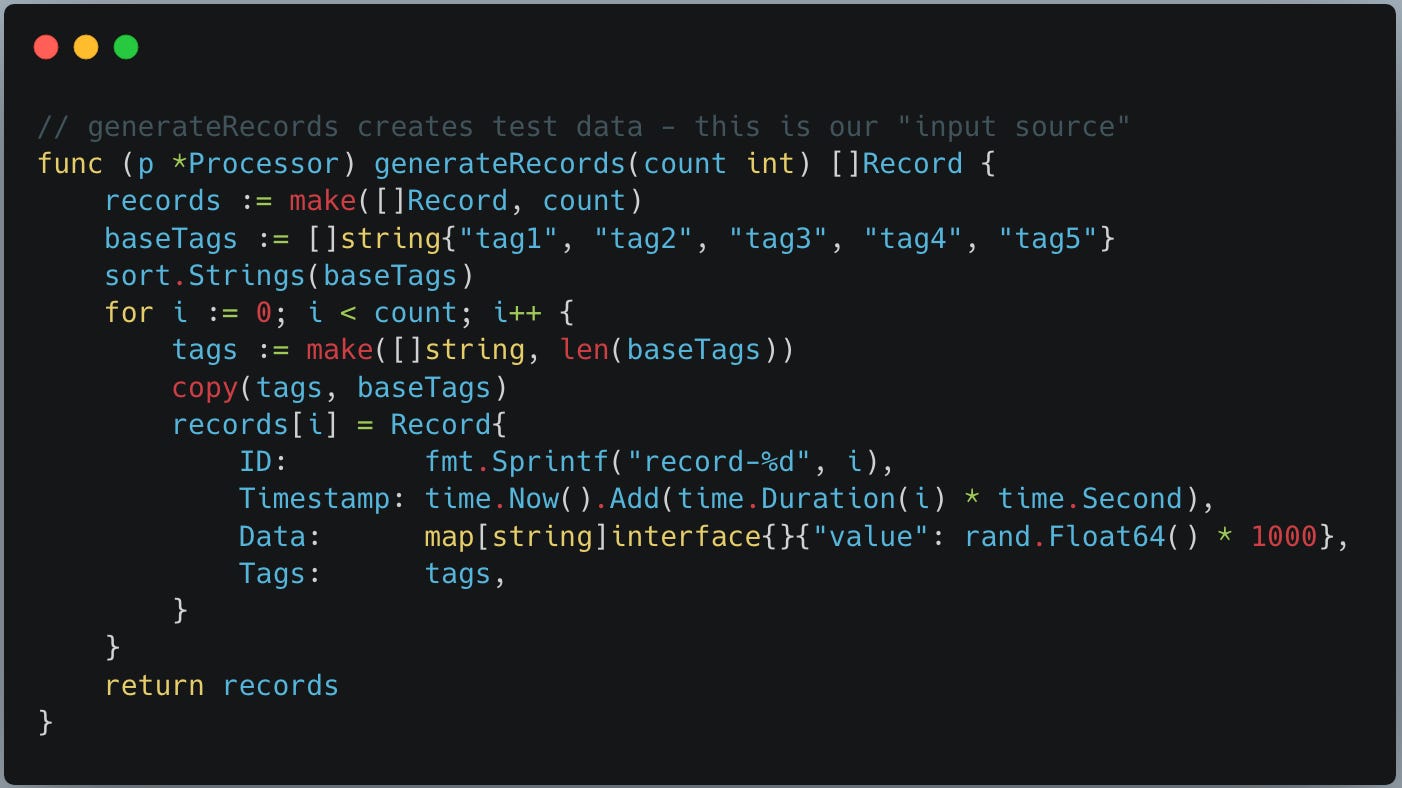
and improve sorting by sorting while generating test data itself so that we completely remove the sortTags func.
Now, when you run pprof allocs, you will see a lot improvement:
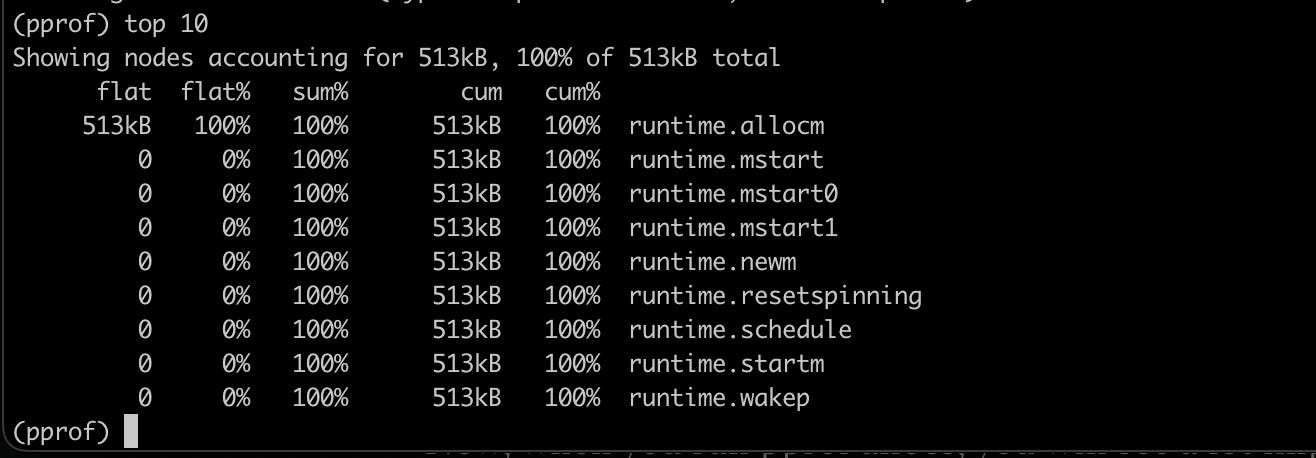
Pls note, now allocs not flagging createKey, sortTags, generateRecords.
Sameway you can try profiling many other pprof options such as:
go tool pprof http://localhost:8080/debug/pprof/goroutine
go tool pprof http://localhost:8080/debug/pprof/block
go tool pprof http://localhost:8080/debug/pprof/mutex
Visualizing the Problem
You can visualize the pprof result visually on browser.
As a prerequisite you need to install graphviz in your mac.
brew install graphvizthen run:
go tool pprof -http=:8081 http://localhost:8080/debug/pprof/profile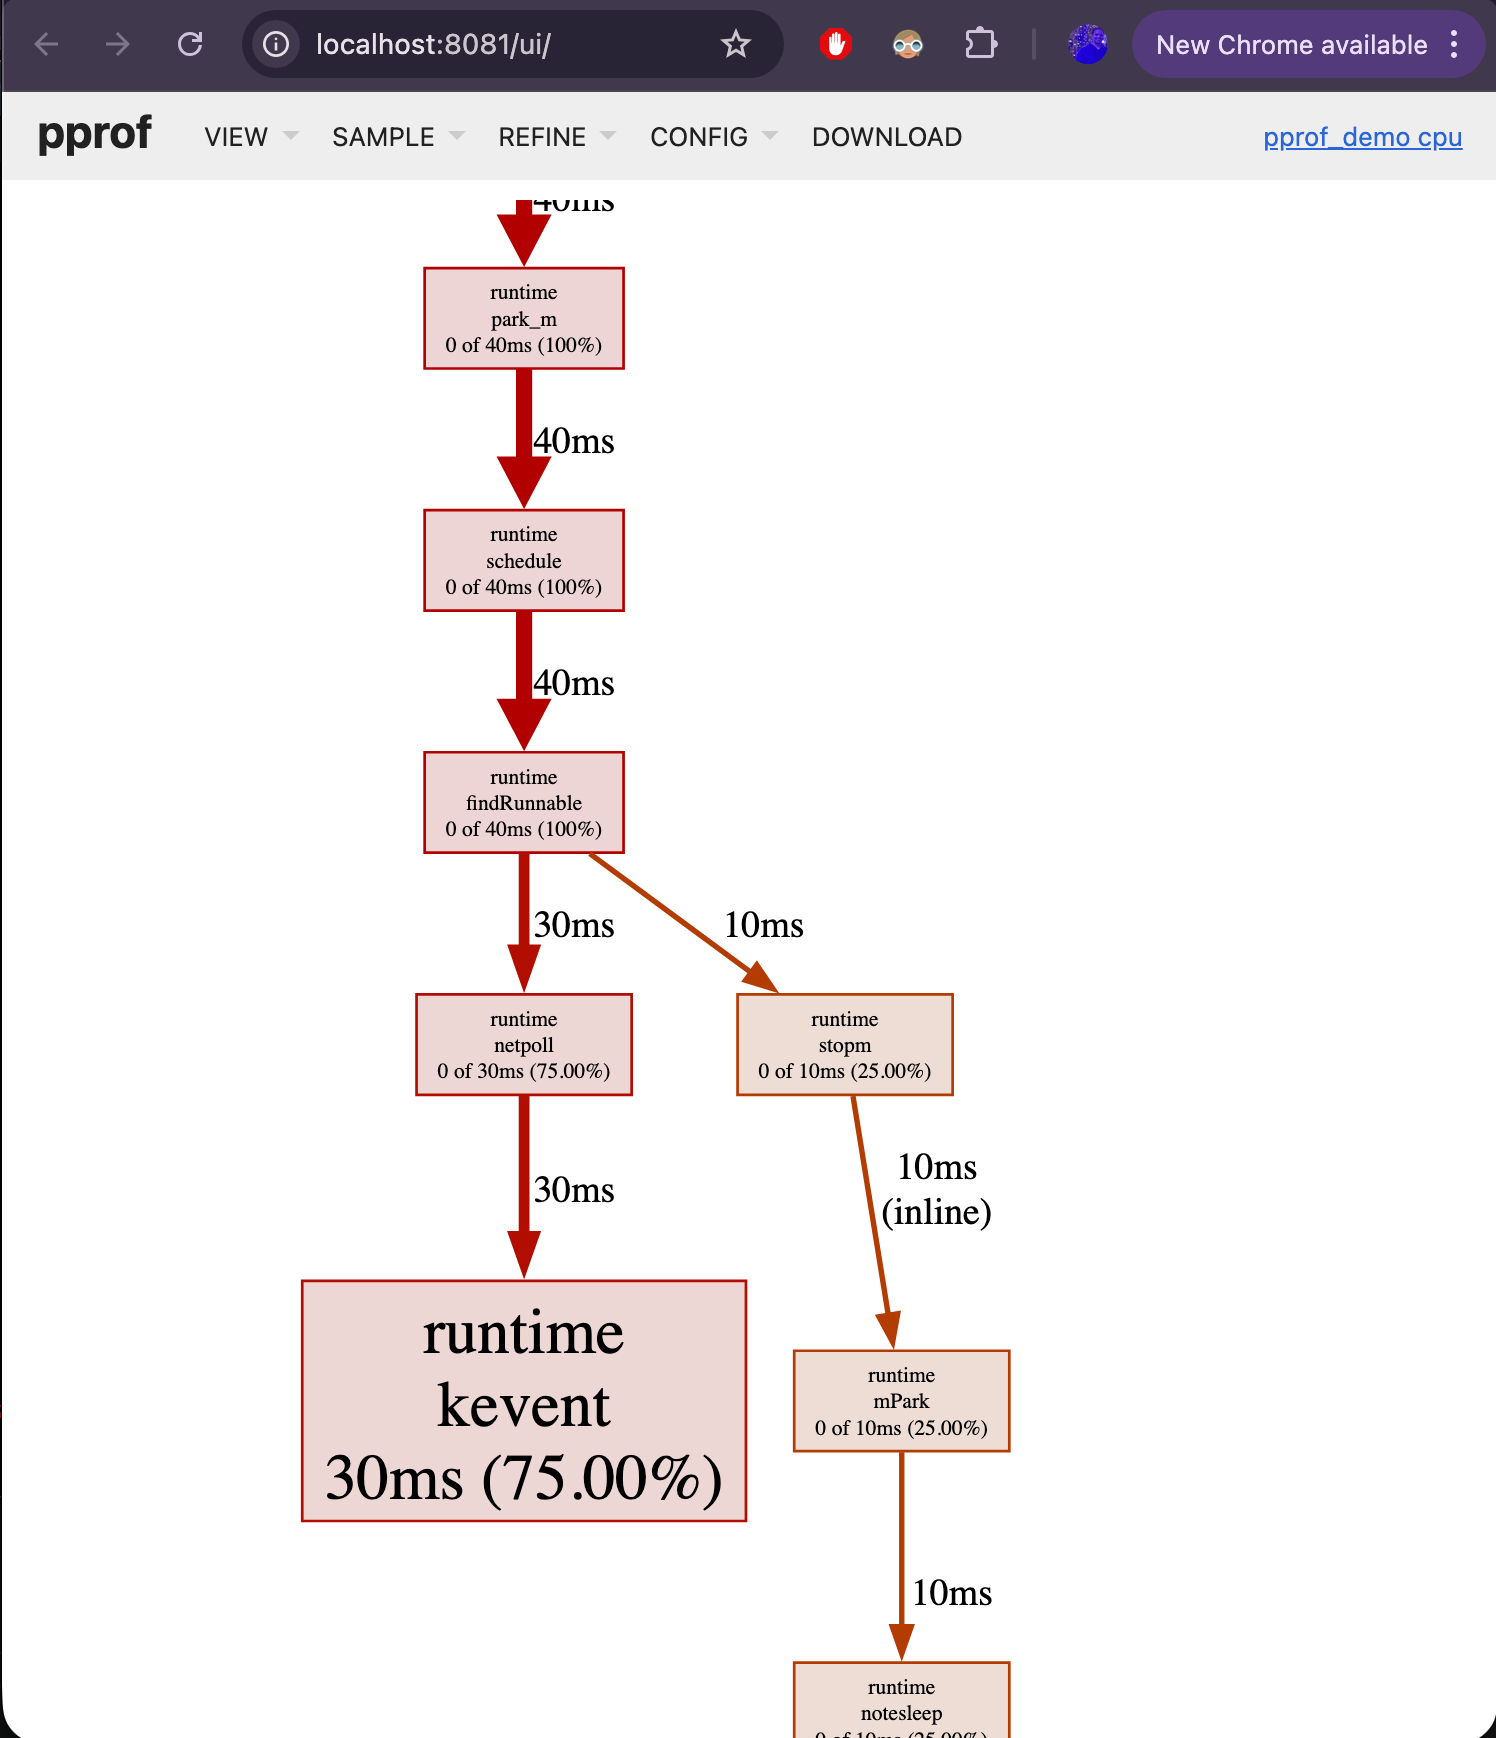
# Generate CPU flame graph
go tool pprof -http=:8081 http://localhost:8080/debug/pprof/profile

# Generate heap flame graph
go tool pprof -http=:8082 http://localhost:8080/debug/pprof/heap

# Generate goroutine graph
go tool pprof -http=:8083 http://localhost:8080/debug/pprof/goroutine
there are many other options to explore. enjoy.
If you enjoyed this deep dive…
I write weekly about:
Go performance and runtime behavior
Kubernetes-native service design
Expert-level engineering lessons from real systems
Subscribe if you want more posts like this.